원그래프는 시각적으로 부분과 전체, 부분과 부분 사이의 비율을 알 수 있어서 다양한 자료에 활용된다.
하지만 둘 이상의 항목을 비교하거나 시간의 흐름을 나타내는 데는 한계가 있다.
원그래프는 데이터를 정확히 분석하는 데 어려움이 있어서 잘 사용하지는 않지만,
뉴스나 보도자료에 시각화 자료로 많이 사용되는 만큼 구현 방법을 알아두는 게 좋을 것 같다.
plotly 패키지에서는 add_trace()와 add_pie()를 사용해 구현할 수 있다.
00. 패키지 로드 및 데이터 불러오기
## 패키지 로드
library(dplyr)
library(plotly)
library(RColorBrewer)

### 한글 폰트 설정
library(showtext)
font_add_google("Nanum Gothic", "nanumgothic")


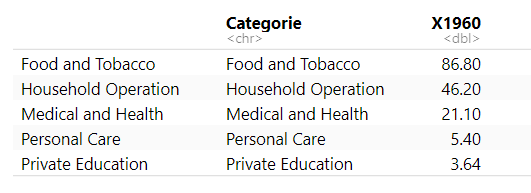
## 미국 개인지출 데이터
USPersonalExpenditure <- data.frame("Categorie"=rownames(USPersonalExpenditure), USPersonalExpenditure)
data <- USPersonalExpenditure[,c('Categorie', 'X1960')]
01. 기본 Pie chart
- pie trace는 다른 trace와 다르게 x, y축을 매핑하지 않고,
대신, values와 labels에 변수를 매핑하고, type = 'pie'로 지정하면 된다.
plot_ly(data,labels = ~Categorie, values = ~X1960,
        type='pie') %>%

  layout(title = 'United States Personal Expenditures by Categories in 1960',
         font=list(family ='nanumgothic'),
         xaxis = list(showgrid = FALSE, zeroline = FALSE, showticklabels = FALSE),
         yaxis = list(showgrid = FALSE, zeroline = FALSE, showticklabels = FALSE),
         margin = list(l=10, r=20, b=10, t=30, pad=0))

02. textinfo 속성
- 기본 원 그래프를 그리면 원 안에 백분율로 데이터가 표시된다. (textinfo = 'percent'가 default이기 때문)
- textinfo는 'label' | 'text' | 'value' | 'percent' 총 4가지가 있으며 '+'로 두 가지 이상의 옵션을 사용할 수 있다.
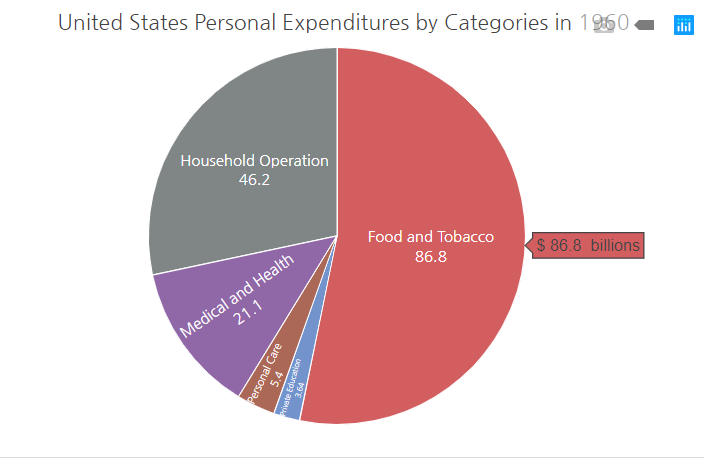
1) textinfo = 'label', label 만 지정
# 카테고리별 원 색상 지정
colors <- c('rgb(211,94,96)', 'rgb(128,133,133)', 'rgb(144,103,167)', 'rgb(171,104,87)', 'rgb(114,147,203)')


plot_ly(data,
        labels = ~Categorie, values = ~X1960, type='pie',
        textposition = 'inside',
        textinfo = 'label',
        insidetextfont = list(color = '#FFFFFF'),# 폰트 컬러지정

        hoverinfo = 'text',
        text = ~paste('$', X1960, ' billions'), # 호버에 표시될 text 설정
        marker = list(colors = colors, # 각 원의 컬러 지정
                      line = list(color = '#FFFFFF', width = 1)), #원의 라인 컬러지정
        showlegend = FALSE) %>%

  layout(title = 'United States Personal Expenditures by Categories in 1960',
         font=list(family ='nanumgothic'),
         xaxis = list(showgrid = FALSE, zeroline = FALSE, showticklabels = FALSE),
         yaxis = list(showgrid = FALSE, zeroline = FALSE, showticklabels = FALSE),
         margin = list(l=10, r=20, b=10, t=30, pad=0))

2) textinfo = 'label+value'
plot_ly(data,
        labels = ~Categorie, values = ~X1960, type='pie',
        textposition = 'inside',
        textinfo = 'label+value',
        insidetextfont = list(color = '#FFFFFF'),# 폰트 컬러지정

        hoverinfo = 'text',
        text = ~paste('$', X1960, ' billions'), # 호버에 표시될 text 설정
        marker = list(colors = colors, # 각 원의 컬러 지정
                      line = list(color = '#FFFFFF', width = 1)), #원의 라인 컬러지정
        showlegend = FALSE) %>%

  layout(title = 'United States Personal Expenditures by Categories in 1960',
         font=list(family ='nanumgothic'),
         xaxis = list(showgrid = FALSE, zeroline = FALSE, showticklabels = FALSE),
         yaxis = list(showgrid = FALSE, zeroline = FALSE, showticklabels = FALSE),
         margin = list(l=10, r=20, b=10, t=30, pad=0))

3) textinfo = 'label+value+percent'
plot_ly(data,
        labels = ~Categorie, values = ~X1960, type='pie',
        textposition = 'inside',
        textinfo = 'label+value+percent',
        insidetextfont = list(color = '#FFFFFF'),# 폰트 컬러지정

        hoverinfo = 'text',
        text = ~paste('$', X1960, ' billions'), # 호버에 표시될 text 설정
        marker = list(colors = colors, # 각 원의 컬러 지정
                      line = list(color = '#FFFFFF', width = 1)), #원의 라인 컬러지정
        showlegend = FALSE) %>%

  layout(title = 'United States Personal Expenditures by Categories in 1960',
         font=list(family ='nanumgothic'),
         xaxis = list(showgrid = FALSE, zeroline = FALSE, showticklabels = FALSE),
         yaxis = list(showgrid = FALSE, zeroline = FALSE, showticklabels = FALSE),
         margin = list(l=10, r=20, b=10, t=30, pad=0))

03. textposition 속성
- 원 안에 표시되는 데이터의 위치를 textposition 속성을 사용해서 변경할 수 있다.
- "inside" | "outside" | "auto" | "none"
1) inside
plot_ly(data,
        labels = ~Categorie, values = ~X1960, type='pie',
        textposition = 'inside',
        textinfo = 'label+percent',
        insidetextfont = list(color = '#FFFFFF'),# 폰트 컬러지정

        hoverinfo = 'text',
        text = ~paste('$', X1960, ' billions'), # 호버에 표시될 text 설정
        marker = list(colors = colors, # 각 원의 컬러 지정
                      line = list(color = '#FFFFFF', width = 1)), #원의 라인 컬러지정
        showlegend = FALSE) %>%

  layout(title = "textposition ='inside'",
         font=list(family ='nanumgothic'),
         xaxis = list(showgrid = FALSE, zeroline = FALSE, showticklabels = FALSE),
         yaxis = list(showgrid = FALSE, zeroline = FALSE, showticklabels = FALSE),
         margin = list(l=10, r=20, b=10, t=30, pad=0))

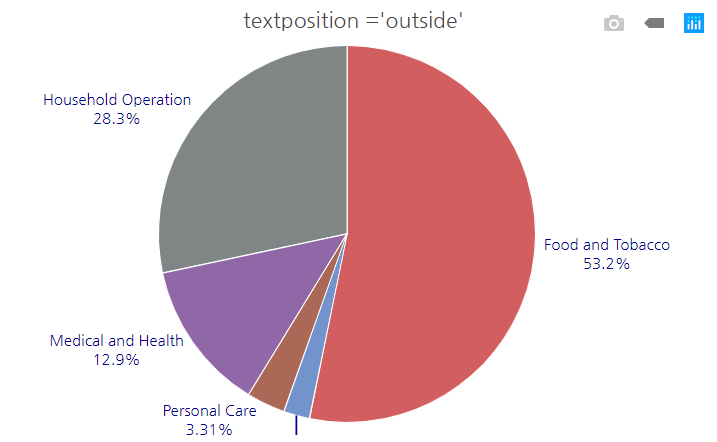
2) outside
plot_ly(data,
        labels = ~Categorie, values = ~X1960, type='pie',
        textposition = 'outside',
        textinfo = 'label+percent',
        outsidetextfont = list(color = 'darkblue'),# 폰트 컬러지정

        hoverinfo = 'text',
        text = ~paste('$', X1960, ' billions'), # 호버에 표시될 text 설정
        marker = list(colors = colors, # 각 원의 컬러 지정
                      line = list(color = '#FFFFFF', width = 1)), #원의 라인 컬러지정
        showlegend = FALSE) %>%

  layout(title = "textposition ='outside'",
         font=list(family ='nanumgothic'),
         xaxis = list(showgrid = FALSE, zeroline = FALSE, showticklabels = FALSE),
         yaxis = list(showgrid = FALSE, zeroline = FALSE, showticklabels = FALSE),
         margin = list(l=10, r=20, b=10, t=30, pad=0))

04. Subplots
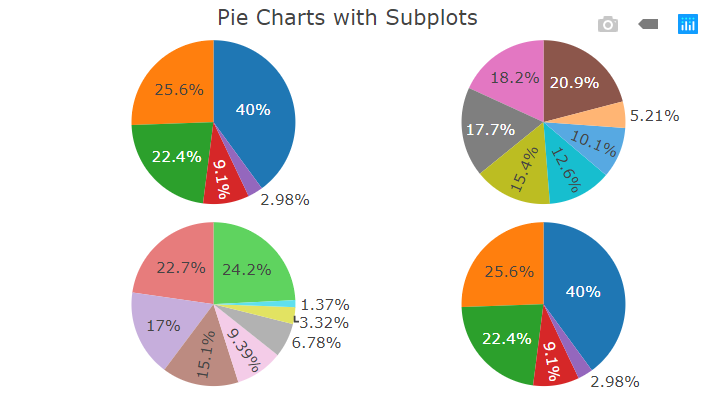
- 여러 개의 pie 그래프를 한 그리드에 그리기 위해서는 domain 속성을 사용해야 한다.
- domain = list (column=0, row =0, x = c(0,1) , y = c(0,1))
- x는 수평 비율을 조절하고, y는 수직 비율을 조정한다.
# ggplot2 패키지 내장 데이터 셋인 'diamonds' 사용
library(dplyr)

fig <- plot_ly()
fig <- fig %>% add_pie(data = count(diamonds, cut), labels = ~cut, values = ~n,
          name = "Cut", domain = list(x = c(0, 0.4), y = c(0.4, 1)))
fig <- fig %>% add_pie(data = count(diamonds, color), labels = ~color, values = ~n,
          name = "Color", domain = list(x = c(0.6, 1), y = c(0.4, 1)))
fig <- fig %>% add_pie(data = count(diamonds, clarity), labels = ~clarity, values = ~n,
          name = "Clarity", domain = list(x = c(0.25, 0.75), y = c(0, 0.6)))
fig <- fig %>% layout(title = "Pie Charts with Subplots", showlegend = F,
         xaxis = list(showgrid = FALSE, zeroline = FALSE, showticklabels = FALSE),
         yaxis = list(showgrid = FALSE, zeroline = FALSE, showticklabels = FALSE))

fig

- 기본 값 column = 0, row = 0 (0 이상의 정수를 사용하여 배치)
# ggplot2 패키지 내장 데이터 셋인 'diamonds' 사용
fig <- plot_ly()
# 왼쪽 상단 배치
fig <- fig %>% add_pie(data = count(diamonds, cut), labels = ~cut, values = ~n,
                         name = "Cut", domain = list(row = 0, column = 0))
# 오른쪽 상단 배치
fig <- fig %>% add_pie(data = count(diamonds, color), labels = ~color, values = ~n,
                       name = "Color", domain = list(row = 0, column = 1))
# 왼쪽 하단 배치
fig <- fig %>% add_pie(data = count(diamonds, clarity), labels = ~clarity, values = ~n,
                       name = "Clarity", domain = list(row = 1, column = 0))
# 오른쪽 하단 배치
fig <- fig %>% add_pie(data = count(diamonds, cut), labels = ~cut, values = ~n,
                       name = "Clarity", domain = list(row = 1, column = 1))
fig <- fig %>% layout(title = "Pie Charts with Subplots", showlegend = F,
                      grid=list(rows=2, columns=2),
                      xaxis = list(showgrid = FALSE, zeroline = FALSE, showticklabels = FALSE),
                      yaxis = list(showgrid = FALSE, zeroline = FALSE, showticklabels = FALSE))

fig

05. Donut Chart - 도넛 차트
- pie trace의 hole 속성을 사용해 원 그래프를 도넛 차트로 변경할 수 있다.
- hole = 0 (default)이면 원 그래프가 그려지고, 0~1 사이의 값으로 설정하면 도넛 차트가 그려진다.
- hole = 0.5로 지정
plot_ly(data,
        labels = ~Categorie, values = ~X1960,
        type='pie', hole = 0.5,
        textposition = 'inside',
        textinfo = 'label+percent',
        insidetextfont = list(color = '#FFFFFF'),# 폰트 컬러지정

        hoverinfo = 'text',
        text = ~paste('$', X1960, ' billions'), # 호버에 표시될 text 설정
        marker = list(colors = colors, # 각 원의 컬러 지정
                      line = list(color = '#FFFFFF', width = 1)), #원의 라인 컬러지정
        showlegend = FALSE) %>%

  layout(title = "Donut Chart",
         font=list(family ='nanumgothic'),
         xaxis = list(showgrid = FALSE, zeroline = FALSE, showticklabels = FALSE),
         yaxis = list(showgrid = FALSE, zeroline = FALSE, showticklabels = FALSE),
         margin = list(l=10, r=20, b=10, t=30, pad=0))

참고 문헌(reference)
'R > plotly' 카테고리의 다른 글
| R | plotly | Interactive Map(1) - 지도 시각화(점, 밀도) (0) | 2023.02.07 |
|---|---|
| R | plotly | Histogram - 히스토그램 (0) | 2023.02.03 |
| R | plotly | Line Plot - 선 그래프 (1) | 2023.02.02 |
| R | plotly | Bubble Chart - 버블 차트 (0) | 2023.02.01 |
| R | plotly | Scatter Plot - 산점도 (0) | 2023.02.01 |
