Line Plot, 선 그래프는 x축의 연속형 변수 or 순서나 크기가 있는 이산형 변수, ordered factor의 변화에 따른 y축의 변화를 선으로 이어서 보여주는 그래프이다.
여기서 x축이 시간의 순서이면 시계열 그래프(Time Series Graph)가 된다.
plotly 패키지에서는 Line Plot을 그리기 위한
add_trace() 함수와 add_lines() 함수를 제공한다.
00. 패키지 로드 및 데이터 불러오기
## 패키지 로드
library(dplyr)
library(plotly)
library(RColorBrewer)

### 한글 폰트 설정
library(showtext)
font_add_google("Nanum Gothic", "nanumgothic")
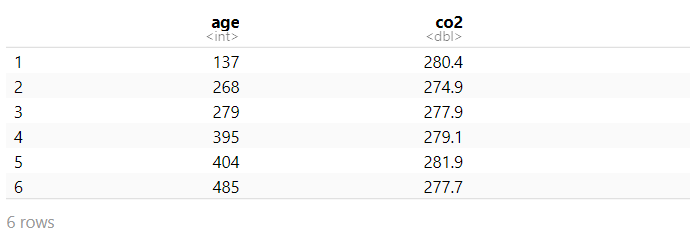
· 사용 데이터 : 남극 얼음의 이산화탄소 함유량 자료
df <- read.csv("https://vincentarelbundock.github.io/Rdatasets/csv/DAAG/edcCO2.csv")
data.2 <- df[-1]
head(data.2)
01. 기본 Line Plot
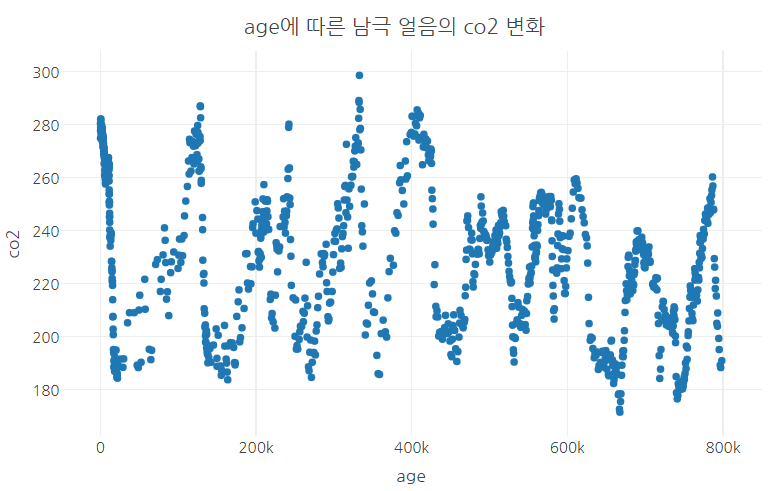
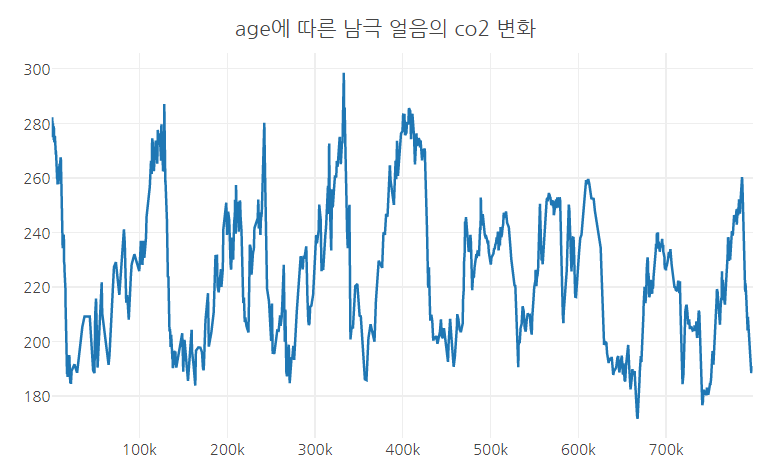
· age에 따른 남극 얼음의 co2 변화
1) 산점도
- 산점도를 그리는 방법은 이전 포스팅을 확인(https://boring9.tistory.com/27)
R | plotly | Scatter Plot - 산점도
Scatter Plot , 산점도는 두 개의 연속형(continuous) 데이터의 상관관계를 파악하기에 매우 유용한 그래프이다. plotly 패키지를 이용해 산점도를 그리기 위해선 add_trace() 또는 add_markers() 함수를 사용하
boring9.tistory.com
plot_ly(data.2,x=~age,y=~co2,
        type='scatter') %>%

        layout(title = "age에 따른 남극 얼음의 co2 변화",
               font=list(family ='nanumgothic'),
               xaxis = list(title="age", zeroline = F),
               yaxis = list(title="co2", zeroline = F),
               margin = list(l=10, r=20, b=10, t=30, pad=0))
2) 라인 그래프
- 라인 그래프를 그리기 위해서는 산점도를 그렸던 코드에서 trace의 mode 속성에 'lines'을 지정해주면 된다.
plot_ly(data.2,x=~age,y=~co2,
        type='scatter',
        mode = 'lines') %>%

        layout(title = "age에 따른 남극 얼음의 co2 변화",
               font=list(family ='nanumgothic'),
               xaxis = list(title="age", zeroline = F),
               yaxis = list(title="co2", zeroline = F),
               margin = list(l=10, r=20, b=10, t=30, pad=0))
3) 산점도 + 라인 그래프
- 산점도와 라인 그래프를 동시에 그리려면 mode = "lines + markers"를 지정하면 된다.
plot_ly(data.2,x=~age,y=~co2,
        type='scatter',
        mode = 'lines+markers') %>%

        layout(title = "age에 따른 남극 얼음의 co2 변화",
               font=list(family ='nanumgothic'),
               xaxis = list(title="age", zeroline = F),
               yaxis = list(title="co2", zeroline = F),
               margin = list(l=10, r=20, b=10, t=30, pad=0))

02. 두 개 이상의 연속형 변수의 변화를 보는 Line plot
· 사용 데이터: R 내장 데이터 셋인 'airquality' 사용

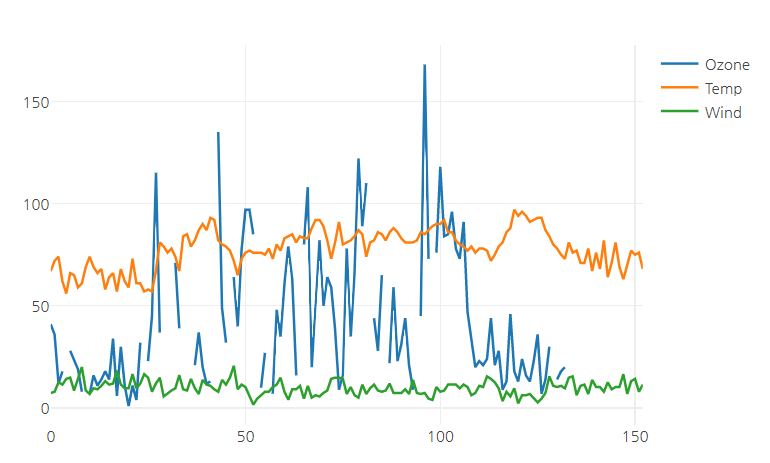
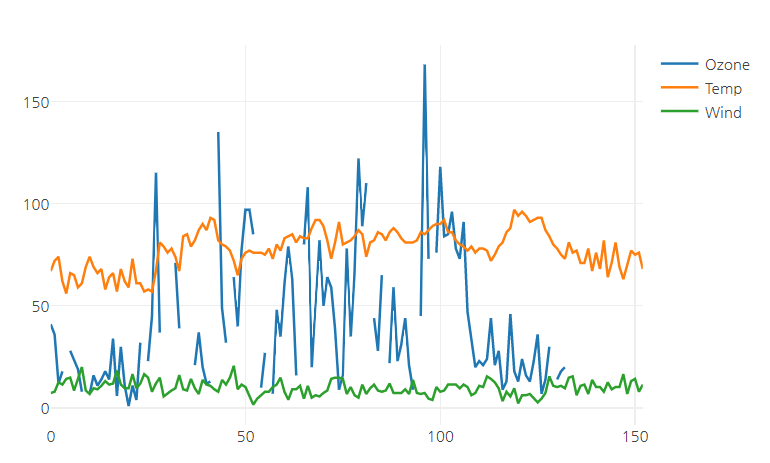
1) 두 개의 add_trace() 사용
- 시각화 하려는 연속형 변수가 각각 서로 다른 열에 있을 경우에는 add_trace()를 연결하여 사용한다.
plot_ly(airquality,y=~Ozone,
        type='scatter',
        mode = 'lines',
        name = 'Ozone') %>%
  add_trace(airquality,y=~Temp,
        type='scatter',
        mode = 'lines',
        name = 'Temp') %>%
    add_trace(airquality,y=~Wind,
        type='scatter',
        mode = 'lines',
        name = 'Wind') %>%

  layout(title = "",
         font=list(family ='nanumgothic'),
         xaxis = list(title="age", zeroline = F),
         yaxis = list(title="co2", zeroline = F),
         margin = list(l=10, r=20, b=10, t=30, pad=0))
2) 데이터 재구성(melt) 한 후 split 속성 사용
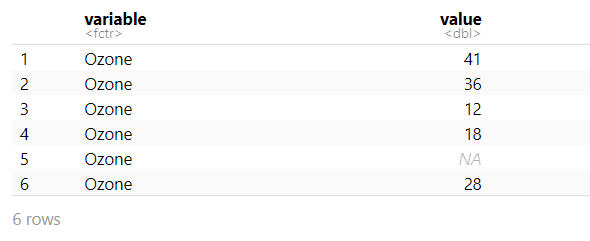
- Ozone, Temp, Wind을 하나의 열로 만들기 위해 reshape2 패키지의 melt() 함수 사용
library(reshape2)

air.use <- airquality %>% select(Ozone, Temp, Wind) %>% melt()
air.use %>% summary()
air.use %>% head()
- split = ~ variable 을 사용하여 그룹별로 Line Plot 그리기
plot_ly(air.use,y=~value,
        type='scatter',
        mode = 'lines',
        split = ~variable) %>%

  layout(title = "split = ~variable",
         font=list(family ='nanumgothic'),
         xaxis = list(title="", zeroline = F),
         yaxis = list(title="", zeroline = F),
         margin = list(l=10, r=20, b=10, t=30, pad=0))

03. Color 속성
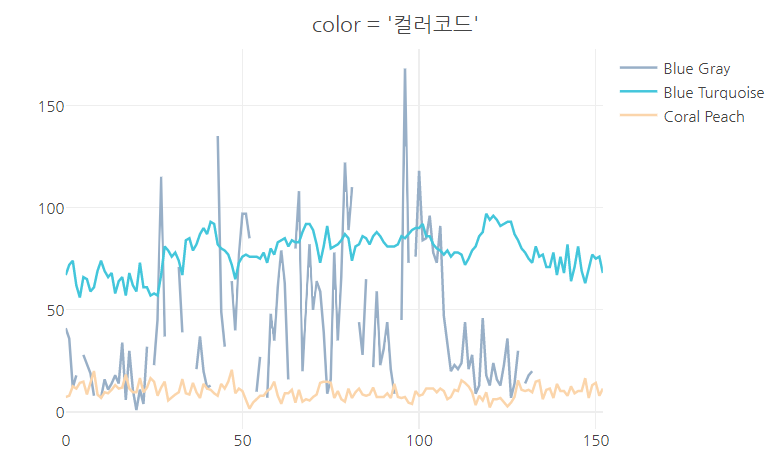
1) 개별 color 지정
- trace안의 line 속성을 사용해 지정할 수 있다.
plot_ly(
        data = airquality,y=~Ozone,
        type='scatter',
        mode = 'lines',
        name = 'Blue Gray',
        line = list(color = "#98AFC7")) %>%

  add_trace(data = airquality,y=~Temp,
        type='scatter',
        mode = 'lines',
        name = 'Blue Turquoise',
        line = list(color = "#43C6DB")) %>%

  add_trace(data = airquality,y=~Wind,
        type='scatter',
        mode = 'lines',
        name = 'Coral Peach',
        line = list(color = "#FBD5AB")) %>%

  layout(title = "color = '컬러코드'",
         font=list(family ='nanumgothic'),
         xaxis = list(title="", zeroline = F),
         yaxis = list(title="", zeroline = F),
         margin = list(l=10, r=20, b=10, t=30, pad=0))
2) color 속성에 범주형 변수 매핑
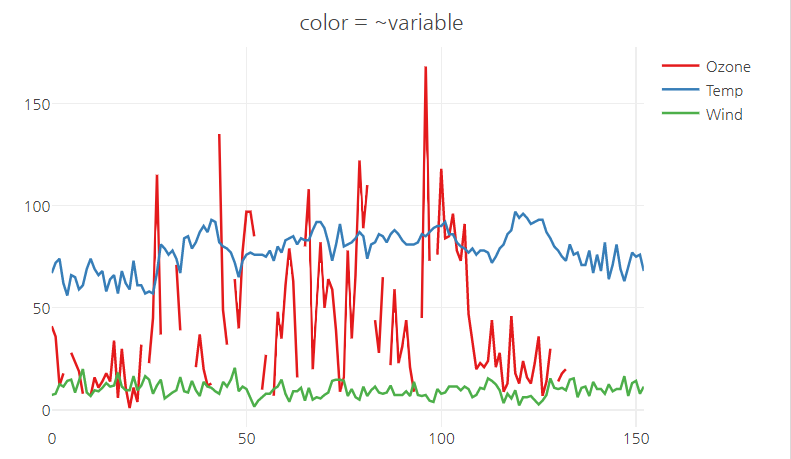
- plotly 컬러 팔레트 사용
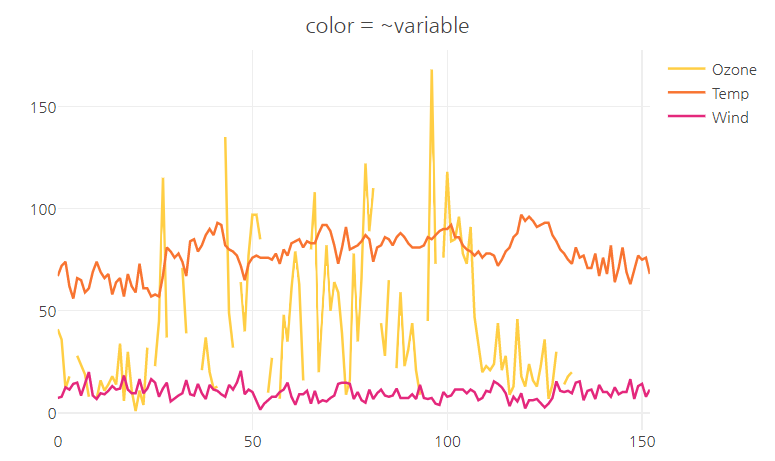
- color 속성에 범주형 변수인 'variable'을 매핑하면 그룹별로 색상을 달리 할 수 있다.
plot_ly(air.use,y=~value,
        type='scatter',
        mode = 'lines',
        split = ~variable,
        color = ~variable,
        colors = "Set1") %>%

  layout(title = "color = ~variable ",
         font=list(family ='nanumgothic'),
         xaxis = list(title="", zeroline = F),
         yaxis = list(title="", zeroline = F),
         margin = list(l=10, r=20, b=10, t=30, pad=0))
- color = ~ variable, colors = c()로 개별 색상 지정
plot_ly(air.use,y=~value,
        type='scatter',
        mode = 'lines',
        color = ~variable,
        colors = c("#FFCE44", "#F87431", "#E4287C")) %>%

  layout(title = "color = ~variable",
         font=list(family ='nanumgothic'),
         xaxis = list(title="", zeroline = F),
         yaxis = list(title="", zeroline = F),
         margin = list(l=10, r=20, b=10, t=30, pad=0))
04. linetype 속성
- linetype 속성에 범주형 변수를 매핑하면 그룹별로 linetype을 달리 할 수 있다.
- linetype = ~variable
plot_ly(air.use,y=~value,
        type='scatter',
        mode = 'lines',
        split = ~variable,
        line = list(width = 3),
        linetype = ~variable) %>%

  layout(title = "linetype = ~variable ",
         font=list(family ='nanumgothic'),
         xaxis = list(title="", zeroline = F),
         yaxis = list(title="", zeroline = F),
         margin = list(l=10, r=20, b=10, t=30, pad=0))

05. line 속성
- line = list() 안에 여러 속성을 추가하면 라인을 사용자가 직접 커스텀 할 수 있다.
1) dash
- dash 옵션을 변경하면 line 그래프를 여러가지 점선으로 표현할 수 있다.
- "solid"(default), "dot", "dash", "longdash", "dashdot", or "longdashdot"
x <- c(1:5)
y <- c(1, 3, 2, 3, 1)

fig <- plot_ly(x = ~x)
fig <- fig %>% add_lines(y = ~y, name = "solid", line = list(dash = "solid", width = 4))
fig <- fig %>% add_lines(y = y + 5, name = "dot", line = list(dash = "dot", width = 4))
fig <- fig %>% add_lines(y = y + 10, name = "dash", line = list(dash = "dash", width = 4))
fig <- fig %>% add_lines(y = y + 15, name = "longdash", line = list(dash = "longdash", width = 4))
fig <- fig %>% add_lines(y = y + 20, name = "dashdot", line = list(dash = "dashdot", width = 4))
fig <- fig %>% add_lines(y = y + 25, name = "longdashdot", line = list(dash = "longdashdot", width = 4))

fig %>% layout(title = "dash 종류",
         font=list(family ='nanumgothic'),
         xaxis = list(title="", zeroline = F),
         yaxis = list(title="", zeroline = F),
         margin = list(l=10, r=20, b=10, t=30, pad=0))

2) shape
- shape을 사용하면 line의 모양을 변경할 수 있다.
- "linear"(default) | "spline" | "hv" | "vh" | "hvh" | "vhv"
fig <- plot_ly(x = ~x)
fig <- fig %>% add_lines(y = ~y, name = "linear", line = list(shape = "linear", width = 4))
fig <- fig %>% add_lines(y = y + 5, name = "spline", line = list(shape = "spline", width = 4))
fig <- fig %>% add_lines(y = y + 10, name = "vhv", line = list(shape = "vhv", width = 4))
fig <- fig %>% add_lines(y = y + 15, name = "hvh", line = list(shape = "hvh", width = 4))
fig <- fig %>% add_lines(y = y + 20, name = "vh", line = list(shape = "vh", width = 4))
fig <- fig %>% add_lines(y = y + 25, name = "hv", line = list(shape = "hv", width = 4))

fig %>% layout(title = "shape 종류",
         font=list(family ='nanumgothic'),
         xaxis = list(title="", zeroline = F),
         yaxis = list(title="", zeroline = F),
         margin = list(l=10, r=20, b=10, t=30, pad=0))

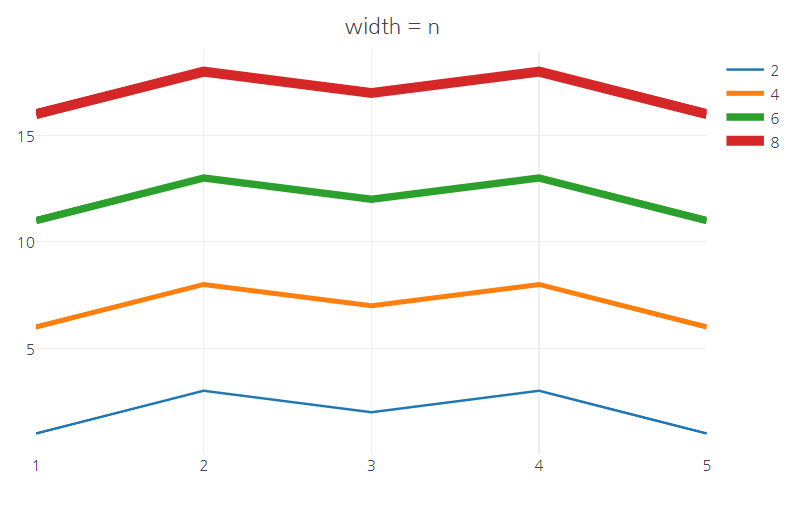
3) width
- width 속성을 사용하여 line의 두께를 변경할 수 있다.
fig <- plot_ly(x = ~x)
fig <- fig %>% add_lines(y = ~y, name = "2", line = list( width = 2))
fig <- fig %>% add_lines(y = y + 5, name = "4", line = list(width = 4))
fig <- fig %>% add_lines(y = y + 10, name = "6", line = list(width = 6))
fig <- fig %>% add_lines(y = y + 15, name = "8", line = list(width = 8))

fig %>% layout(title = "width = n",
         font=list(family ='nanumgothic'),
         xaxis = list(title="", zeroline = F),
         yaxis = list(title="", zeroline = F),
         margin = list(l=10, r=20, b=10, t=30, pad=0))
06. add_annotations()
- 범례를 사용하지 않고, 각각의 line의 시각화 한 변수의 이름을 넣기 위해서
plotly 패키지에서는 add_annotations() 함수를 제공한다.
- 각각의 선 trace의 마지막 위치를 x, y에 설정해주고,
해당 위치에 add_annotations()를 사용하여 주석의 형태로 텍스트를 넣어주면 된다.
· airquality 데이터 셋에서 5월 자료만 추출하여 melt()를 실행한다.
air.use2 <- airquality %>% filter(Month == "5") %>%
                          select(Day, Ozone,Solar.R, Temp, Wind) %>%
                          melt(id.vars = 'Day')
air.use2 %>% summary()
air.use2 %>% head()

plot_ly(air.use2,x = ~Day, y=~value,
        type='scatter',
        mode = 'lines+text',
        split = ~variable,
        connectgaps = T, # NA 값이 존재하기 때문에 NA 무시하고 연결
        showlegend = F) %>%
  ## Ozone trace 마지막 위치에 주석 추가
  add_annotations(text = 'Ozone',
                  x =  air.use2 %>% filter(variable == 'Ozone' & Day ==max(Day)) %>%
                    select(Day) %>% pull(),
                  y =  air.use2 %>% filter(variable == 'Ozone' & Day ==max(Day)) %>%
                    select(value) %>% pull(),
                  xanchor = 'left', showarrow = F,
                  font = list(family = "nanumgothic", size =16)) %>%
  ## Solar.R trace 마지막 위치에 주석 추가
  add_annotations(text = 'Solar.R',
                  x =  air.use2 %>% filter(variable == 'Solar.R' & Day ==max(Day)) %>%
                    select(Day) %>% pull(),
                  y =  air.use2 %>% filter(variable == 'Solar.R' & Day ==max(Day)) %>%
                    select(value) %>% pull(),
                  xanchor = 'left', showarrow = F,
                  font = list(family = "nanumgothic", size =16)) %>%
  ## Temp trace 마지막 위치에 주석 추가
  add_annotations(text = 'Temp',
                  x =  air.use2 %>% filter(variable == 'Temp' & Day ==max(Day)) %>%
                    select(Day) %>% pull(),
                  y =  air.use2 %>% filter(variable == 'Temp' & Day ==max(Day)) %>%
                    select(value) %>% pull(),
                  xanchor = 'left', showarrow = F,
                  font = list(family = "nanumgothic", size =16)) %>%
  ## Wind trace 마지막 위치에 주석 추가
  add_annotations(text = 'Wind',
                  x =  air.use2 %>% filter(variable == 'Wind' & Day ==max(Day)) %>%
                    select(Day) %>% pull(),
                  y =  air.use2 %>% filter(variable == 'Wind' & Day ==max(Day)) %>%
                    select(value) %>% pull(),
                  xanchor = 'left', showarrow = F,
                  font = list(family = "nanumgothic", size =16)) %>%


  layout(title = "Label Lines with Annotations",
         font=list(family ='nanumgothic'),
         xaxis = list(title="", zeroline = F),
         yaxis = list(title="", zeroline = F),
         margin = list(l=10, r=20, b=10, t=30, pad=0))

참고 문헌(reference)
참고 사이트
https://plotly.com/r/line-charts/
Line
Over 9 examples of Line Plots including changing color, size, log axes, and more in R.
plotly.com
https://2stndard.tistory.com/88
plotly 선 그래프의 끝에 범례 넣기
사용데이터 : https://2stndard.tistory.com/68 다음과 같이 주요 나라의 코로나 19 사망자 추세 그래프를 그려보자. total_deaths_5_nations_by_day filter((iso_code %in% c('KOR', 'USA', 'JPN', 'GBR', 'FRA'))) |> filter(!is.na(total_d
2stndard.tistory.com
'R > plotly' 카테고리의 다른 글
| R | plotly | Histogram - 히스토그램 (0) | 2023.02.03 |
|---|---|
| R | plotly | Pie chart - 원 그래프 (0) | 2023.02.03 |
| R | plotly | Bubble Chart - 버블 차트 (0) | 2023.02.01 |
| R | plotly | Scatter Plot - 산점도 (0) | 2023.02.01 |
| R | plotly | Violin Plot - 바이올린 플롯 (0) | 2023.01.31 |
