
이번 포스팅에서는 기술 통계에서 중요한 그래프인 박스 플롯을 plotly 패키지를 사용해서 구현해 볼 것이다.
박스플롯은 데이터의 분포와 이상치를 동시에 보여주면서
서로 다른 범주에 있는 데이터 군을 비교할 때 유용하다.
로우 데이터를 그대로 사용하지 않고,
총 5가지의 요약값(최소값, 최대값, 제1사분위수, 제2사분위수(중앙값), 제3사분위수)을 사용해 데이터를 파악할 수 있다.
plotly 패키지에서는 add_trace(type = 'box')를 사용하거나 add_boxplot()을 사용한다.
그래프 조작은 html 파일 다운로드 하세요~!
00. 패키지 로드 및 데이터 불러오기
- 크론병 데이터
library(dplyr)
library(plotly)

library(showtext)
### 한글 폰트 설정
font_add_google("Nanum Gothic", "nanumgothic")
df <- read.csv("https://vincentarelbundock.github.io/Rdatasets/csv/robustbase/CrohnD.csv")
data <- df[-1]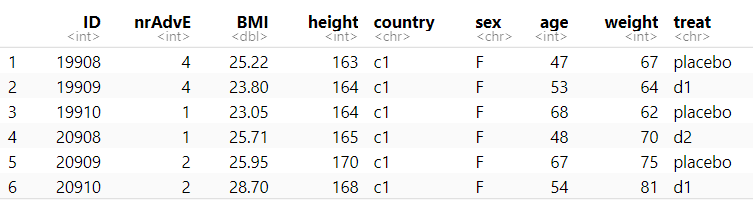
01. 연속형 변수 box plot
- 기본적으로 box plot을 그리기 위해서는 x or y축에 연속형 변수를 매핑하고, type = 'box'로 지정해야 한다.
plot_ly(data = , x = ~, y = ~, type = 'box')
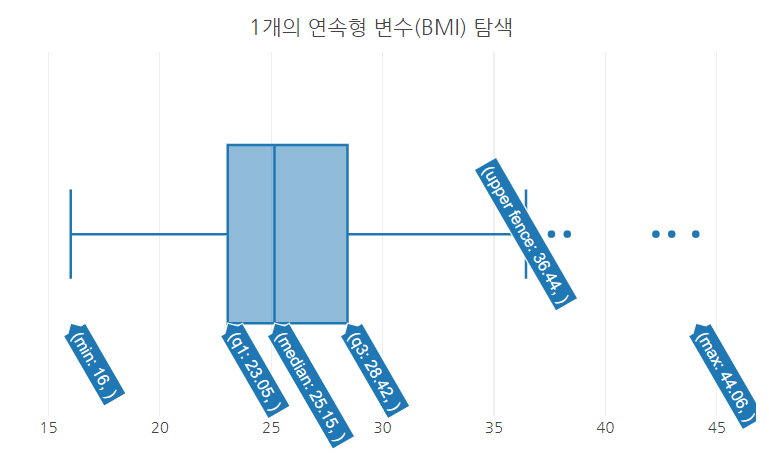
- 연속형 변수 'BMI'의 분포를 확인
## 수직 box plot
plot_ly(df , x='', y=~BMI, type='box')%>%

  layout(title = "1개의 연속형 변수(BMI) 탐색",
         font=list(family ='nanumgothic'),
         xaxis = list(title=""),
         yaxis = list(title=""),
         margin = list(l=10, r=20, b=10, t=30, pad=0))

## 수평 box plot
plot_ly(df , x=~BMI, y='', type='box')%>%

  layout(title = "1개의 연속형 변수(BMI) 탐색",
         font=list(family ='nanumgothic'),
         xaxis = list(title=""),
         yaxis = list(title=""),
         margin = list(l=10, r=20, b=10, t=30, pad=0))
02. 연속형&범주형 변수 box plot
1) 연속형 변수 1개 범주형 변수 1개 시각화 하기
- 연속형 변수와 범주형 변수 총 2개의 변수를 사용해 box plot을 그리기 위해서는
x, y축에 변수를 매핑하고, type = 'box'로 지정한 후 split 속성에 범주형 변수를 매핑해야 한다.
plot_ly(data = , x = ~범주형변수, y = ~연속형변수, type = 'box',
        split = ~ 범주형변수)
- treat에 따른 환자의 BMI 분포를 보기 위해서 x축에 treat(범주형) 변수를 y축에 BMI(연속형) 변수를 매핑한 후,
split에 treat 변수를 매핑하여 총 3개의 박스플롯으로 나눴다.
plot_ly(data.1,x=~treat,y=~BMI,
              type='box',
              split=~treat) %>%

    layout(title = "treat에 따른 BMI 분포",
         font=list(family ='nanumgothic'),
         xaxis = list(title=""),
         yaxis = list(title=""),
         margin = list(l=10, r=20, b=10, t=30, pad=0))

2) 연속형 변수 1개 범주형 변수 2개 시각화 하기
- 연속형 변수와 범주형 변수 2개 총 3개의 변수를 사용해 box plot을 그리기 위해서는
x, y축에 변수를 매핑하고, type = 'box'로 지정한 후 split 속성에 범주형 변수a & color 속성에 범주형 변수b를 매핑해야 한다.
- 또한 layout(boxmode = 'group')으로 지정해줘야 한다.
plot_ly(data = , x = ~범주형변수a, y = ~연속형변수, type = 'box',
        split = ~ 범주형변수a,
        color = ~ 범주형변수b) %>%
    layout(boxmode ='group')
plot_ly(data.1,x=~treat,y=~BMI,
              type='box',
              split=~treat,
              color = ~sex) %>%

    layout(
         boxmode ='group',
         title = "treat과 sex에 따른 BMI 분포",
         font=list(family ='nanumgothic'),
         xaxis = list(title=""),
         yaxis = list(title=""),
         margin = list(l=10, r=20, b=10, t=30, pad=0))

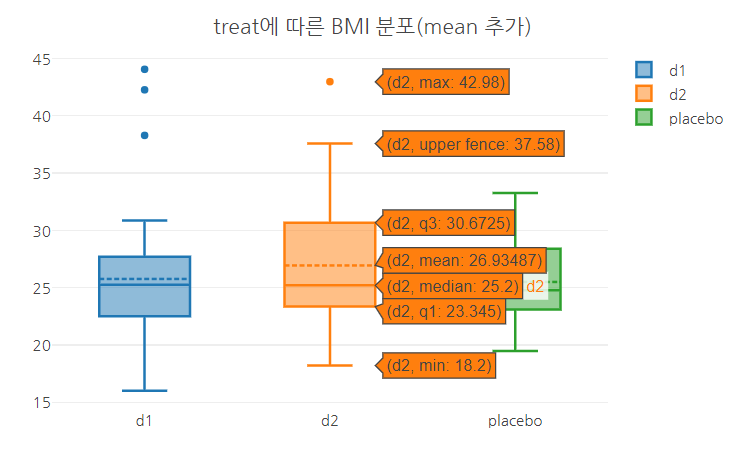
03. 박스플롯에 평균(boxmean) 추가하기
- boxmean 속성을 boxmean = TRUE로 변경해주면 된다.
plot_ly(data.1,x=~treat,y=~BMI,
              type='box',
              split=~treat,
              boxmean = T) %>%

    layout(title = "treat에 따른 BMI 분포(mean 추가)",
         font=list(family ='nanumgothic'),
         xaxis = list(title=""),
         yaxis = list(title=""),
         margin = list(l=10, r=20, b=10, t=30, pad=0))
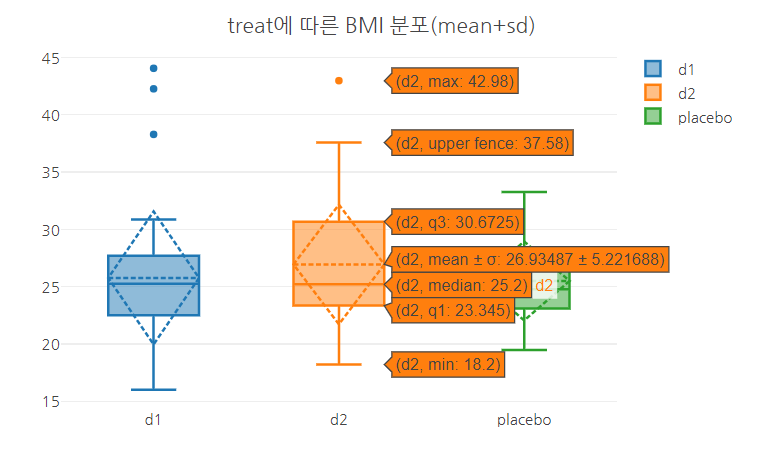
- boxmean = 'sd'로 지정하면 표준편차 정보까지 볼 수 있다.
plot_ly(data.1,x=~treat,y=~BMI,
              type='box',
              split=~treat,
              boxmean = 'sd') %>%

    layout(title = "treat에 따른 BMI 분포(mean+sd)",
         font=list(family ='nanumgothic'),
         xaxis = list(title=""),
         yaxis = list(title=""),
         margin = list(l=10, r=20, b=10, t=30, pad=0))
04. 박스플롯 이상치 설정(boxpoints)
- 박스플롯 이상치 설정은 총 4가지이다.
- 'all', 'outliers', 'suspectedoutliers', 'FALSE'
1) all : 모든 이상치를 보여줌.
plot_ly(data.1,x=~treat,y=~BMI,
              type='box',
              split=~treat,
              boxpoints = 'all') %>%

    layout(title = "boxpoints = 'all'",
         font=list(family ='nanumgothic'),
         xaxis = list(title=""),
         yaxis = list(title=""),
         margin = list(l=10, r=20, b=10, t=30, pad=0))

2) outliers : 수염 외부에 있는 이상치만 표현.
plot_ly(data.1,x=~treat,y=~BMI,
              type='box',
              split=~treat,
              boxpoints = 'outliers') %>%

    layout(title = "boxpoints = 'outliers'",
         font=list(family ='nanumgothic'),
         xaxis = list(title=""),
         yaxis = list(title=""),
         margin = list(l=10, r=20, b=10, t=30, pad=0))

3) suspectedoutliers : 전체 이상치가 표시( IQR의 4배가 넘어가는 이상치는 다시 강조)
plot_ly(data.1,x=~treat,y=~BMI,
              type='box',
              split=~treat,
              boxpoints = 'suspectedoutliers') %>%

    layout(title = "boxpoints = 'suspectedoutliers'",
         font=list(family ='nanumgothic'),
         xaxis = list(title=""),
         yaxis = list(title=""),
         margin = list(l=10, r=20, b=10, t=30, pad=0))

4) FALSE : 이상치 표현 X
plot_ly(data.1,x=~treat,y=~BMI,
              type='box',
              split=~treat,
              boxpoints = FALSE) %>%

    layout(title = "boxpoints = 'FALSE'",
         font=list(family ='nanumgothic'),
         xaxis = list(title=""),
         yaxis = list(title=""),
         margin = list(l=10, r=20, b=10, t=30, pad=0))

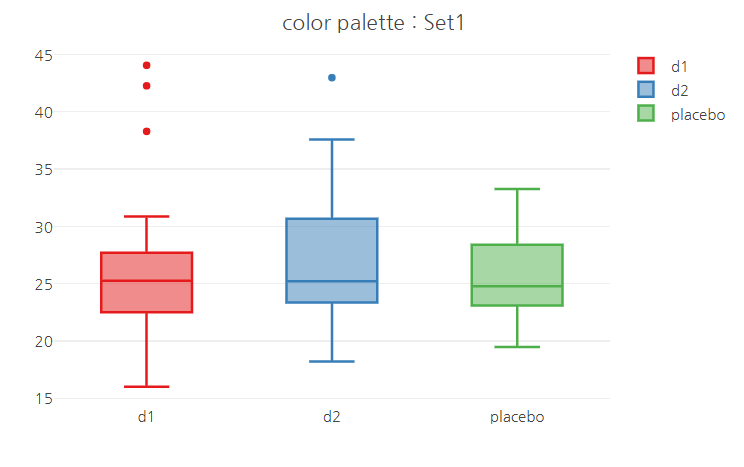
05. color 속성 변경
1) Plotly color palettes
plotly 패키지에서 제공하는 컬러 팔레트를 사용할 수 있다.
Set1, Set2, Set3, Pastel1, Pastel2, Paired, Dark2, Accent 등이 있다.
## Set1
plot_ly(data.1,x=~treat,y=~BMI,
              type='box',
              color =~treat,
              colors = 'Set1') %>%

    layout(title = "color palette : Set1",
         font=list(family ='nanumgothic'),
         xaxis = list(title=""),
         yaxis = list(title=""),
         margin = list(l=10, r=20, b=10, t=30, pad=0))
## Accent
plot_ly(data.1,x=~treat,y=~BMI,
              type='box',
              color =~treat,
              colors = 'Accent') %>%

    layout(title = "color palette : Accent ",
         font=list(family ='nanumgothic'),
         xaxis = list(title=""),
         yaxis = list(title=""),
         margin = list(l=10, r=20, b=10, t=30, pad=0))

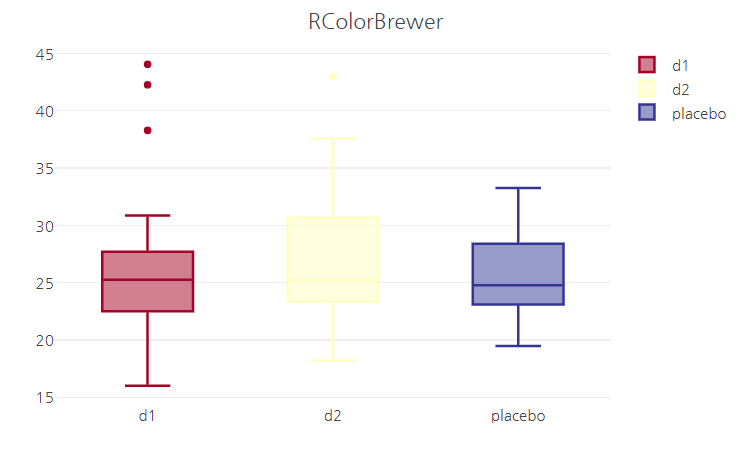
2) RColorBrewer color palettes
RColorBrewer 패키지에서 제공하는 컬러 팔레트 사용
ColorBrewer: Color Advice for Maps
colorbrewer2.org
library(RColorBrewer)
brewer.pal.info

plot_ly(data.1,x=~treat,y=~BMI,
              type='box',
              color =~treat,
              colors = brewer.pal(names(table(data.1$treat)), "RdYlBu")) %>%

    layout(title = "RColorBrewer",
         font=list(family ='nanumgothic'),
         xaxis = list(title=""),
         yaxis = list(title=""),
         margin = list(l=10, r=20, b=10, t=30, pad=0))
참고 문헌(reference)
참고 사이트
https://plotly.com/r/box-plots/
Box
Over 9 examples of Box Plots including changing color, size, log axes, and more in R.
plotly.com
https://2stndard.tistory.com/98
plotly 박스 플롯의 평균과 표준편차 표시와 이상치 표시 in R
사용데이터 : https://2stndard.tistory.com/68 plotly 박스 trace 박스 trace는 박스 플롯을 생성하기 위해 사용되는 trace이다. 박스 플롯은 데이터의 전체적 분포를 4분위수(quantile)과 IQR(Inter Quartile Range)를 사
2stndard.tistory.com
http://rstudio-pubs-static.s3.amazonaws.com/448200_6bb02977b4c04e0da508ac0131f71d48.html
Plotly colors and RColorBrewer
rstudio-pubs-static.s3.amazonaws.com
'R > plotly' 카테고리의 다른 글
| R | plotly | Line Plot - 선 그래프 (1) | 2023.02.02 |
|---|---|
| R | plotly | Bubble Chart - 버블 차트 (0) | 2023.02.01 |
| R | plotly | Scatter Plot - 산점도 (0) | 2023.02.01 |
| R | plotly | Violin Plot - 바이올린 플롯 (0) | 2023.01.31 |
| R | plotly | Bar Chart - 막대 그래프 (0) | 2023.01.30 |