Scatter Plot , 산점도는 두 개의 연속형(continuous) 데이터의 상관관계를 파악하기에 매우 유용한 그래프이다.
plotly 패키지를 이용해 산점도를 그리기 위해선
add_trace() 또는 add_markers() 함수를 사용하면 된다.
00. 패키지 로드 및 데이터 불러오기
## 패키지 로드
library(dplyr)
library(plotly)
library(RColorBrewer)
### 한글 폰트 설정
library(showtext)
font_add_google("Nanum Gothic", "nanumgothic")

## 데이터 불러오기 : 크론병 데이터
df <- read.csv("https://vincentarelbundock.github.io/Rdatasets/csv/robustbase/CrohnD.csv")
data.1 <- df[-1]
data.1 %>% head()

01. 연속형 & 연속형 변수 산점도
- plot_ly() 함수를 사용해 산점도를 시각하기 위해선, x,y축에 연속형 변수를 매핑하고,
type = 'scatter', mode = 'markers'로 지정해야 한다.
plot_ly(data = data.1, x = ~연속형변수, y = ~연속형변수,
        type = 'scatter', mode = 'markers')
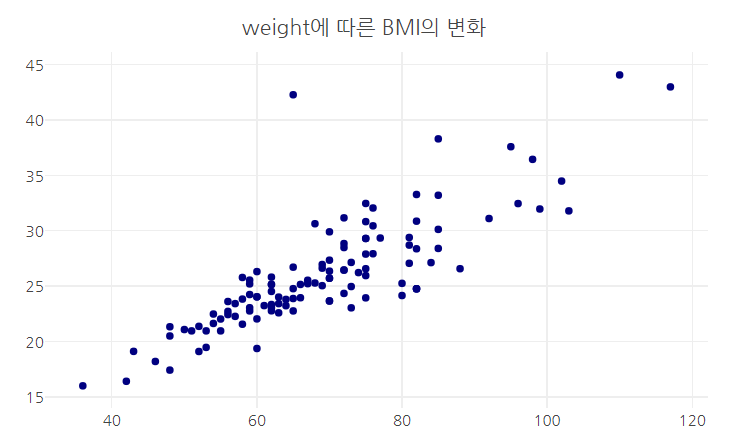
1) 크론병 데이터에서 'weight'와 'BMI' 두 개의 연속형 변수를 사용해서 기본 산점도를 시각화 할 것이다.
plot_ly(data=data.1, x=~weight, y=~BMI,
        type='scatter',
        mode="markers") %>%

  layout(title = "weight에 따른 BMI의 변화",
         font=list(family ='nanumgothic'),
         xaxis = list(title=""),
         yaxis = list(title=""),
         margin = list(l=10, r=20, b=10, t=30, pad=0))

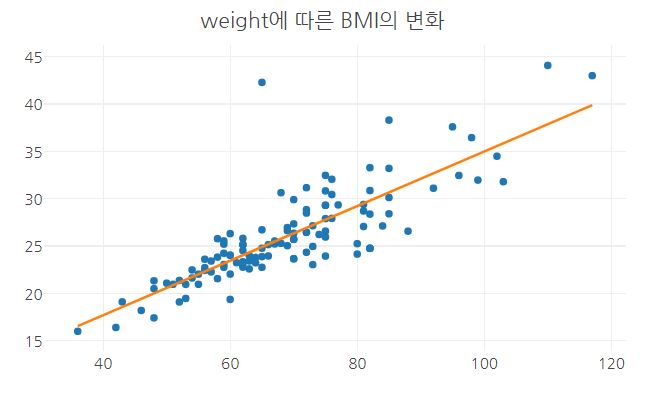
2) 회귀선 추가
## 산점도- 회귀선 추가
fig <- plot_ly(data=data.1, x=~weight, y=~BMI,
        type='scatter',
        mode="markers") %>%
  layout(title = "weight에 따른 BMI의 변화",
         font=list(family ='nanumgothic'),
         xaxis = list(title=""),
         yaxis = list(title=""),
         margin = list(l=10, r=20, b=10, t=30, pad=0))

## 회귀선 적합
fit.value <- lm(BMI~weight, data=data.1) %>%
                  fitted.values() # y절편과 기울기
fig <- fig %>%
        add_trace(x=~weight, y=~fit.value, mode='lines') %>%
        layout(showlegend=F)
fig
02. color 속성
1) color 속성에 컬러코드 입력
- color = '#00008B' 컬러코드 입력

plot_ly(data=data.1, x=~weight, y=~BMI,
        type='scatter',
        mode="markers",
        color = '#000080') %>%

  layout(title = "weight에 따른 BMI의 변화",
         font=list(family ='nanumgothic'),
         xaxis = list(title=""),
         yaxis = list(title=""),
         margin = list(l=10, r=20, b=10, t=30, pad=0))
color 속성에 바로 컬러 코드를 입력하면 위의 그래프처럼 색상이 지정한 색으로 바뀌지 않는다. 사용자가 원하는 색을 직접 설정하기 위해서는 ’asis’를 의미하는 I()를 사용하여 색을 설정하여야 한다.
- color = I( '#00008B' )
## color = I('#000080')
plot_ly(data=data.1, x=~weight, y=~BMI,
        type='scatter',
        mode="markers",
        color = I('#000080')) %>%

  layout(title = "weight에 따른 BMI의 변화",
         font=list(family ='nanumgothic'),
         xaxis = list(title=""),
         yaxis = list(title=""),
         margin = list(l=10, r=20, b=10, t=30, pad=0))
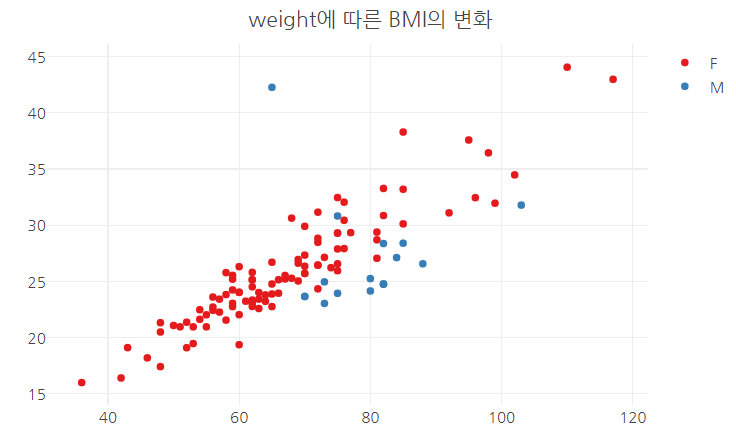
2) color 속성에 범주형 변수 매핑하기
- sex(성별) 범주형 변수를 trace의 color 속성에 매핑한다.
plot_ly(data=data.1, x=~weight, y=~BMI,
        type='scatter',
        mode="markers",
        color = ~sex) %>%

  layout(title = "weight에 따른 BMI의 변화",
         font=list(family ='nanumgothic'),
         xaxis = list(title=""),
         yaxis = list(title=""),
         margin = list(l=10, r=20, b=10, t=30, pad=0))

3) plotly 컬러 팔레트 사용
- color에 sex 범주형 변수를 매핑하고, 추가로 색을 변경하고 싶을 때 colors 속성을 사용하면 된다.
plot_ly(data=data.1, x=~weight, y=~BMI,
        type='scatter',
        mode="markers",
        color = ~sex,
        colors = 'Set1') %>% # plotly 패키지 컬러 팔레트

  layout(title = "weight에 따른 BMI의 변화",
         font=list(family ='nanumgothic'),
         xaxis = list(title=""),
         yaxis = list(title=""),
         margin = list(l=10, r=20, b=10, t=30, pad=0))
4) 색상 직접 지정
- color에 sex 범주형 변수를 매핑하고, 그룹별로 색상을 직접 지정하고 싶을 때는 c()함수 안에 컬러코드를 입력하면 된다.
plot_ly(data=data.1, x=~weight, y=~BMI,
        type='scatter',
        mode="markers",
        color = ~sex,
        colors = c('#A0CFEC','#006A4E')) %>%

  layout(title = "weight에 따른 BMI의 변화",
         font=list(family ='nanumgothic'),
         xaxis = list(title=""),
         yaxis = list(title=""),
         margin = list(l=10, r=20, b=10, t=30, pad=0))

03. Symbol 속성
- symbol 속성을 사용해서 marker 점의 형태를 변경할 수 있다.
- plotly 패키지에서 총 53개의 심볼을 제공한다. (https://plotly.com/r/reference/#scatter-marker-symbol)
- symbol
Parent: data[type=scatter].marker
Type: enumerated or array of enumerateds , one of ( "0" | "0" | "circle" | "100" | "100" | "circle-open" | "200" | "200" | "circle-dot" | "300" | "300" | "circle-open-dot" | "1" | "1" | "square" | "101" | "101" | "square-open" | "201" | "201" | "square-dot" | "301" | "301" | "square-open-dot" | "2" | "2" | "diamond" | "102" | "102" | "diamond-open" | "202" | "202" | "diamond-dot" | "302" | "302" | "diamond-open-dot" | "3" | "3" | "cross" | "103" | "103" | "cross-open" | "203" | "203" | "cross-dot" | "303" | "303" | "cross-open-dot" | "4" | "4" | "x" | "104" | "104" | "x-open" | "204" | "204" | "x-dot" | "304" | "304" | "x-open-dot" | "5" | "5" | "triangle-up" | "105" | "105" | "triangle-up-open" | "205" | "205" | "triangle-up-dot" | "305" | "305" | "triangle-up-open-dot" | "6" | "6" | "triangle-down" | "106" | "106" | "triangle-down-open" | "206" | "206" | "triangle-down-dot" | "306" | "306" | "triangle-down-open-dot" | "7" | "7" | "triangle-left" | "107" | "107" | "triangle-left-open" | "207" | "207" | "triangle-left-dot" | "307" | "307" | "triangle-left-open-dot" | "8" | "8" | "triangle-right" | "108" | "108" | "triangle-right-open" | "208" | "208" | "triangle-right-dot" | "308" | "308" | "triangle-right-open-dot" | "9" | "9" | "triangle-ne" | "109" | "109" | "triangle-ne-open" | "209" | "209" | "triangle-ne-dot" | "309" | "309" | "triangle-ne-open-dot" | "10" | "10" | "triangle-se" | "110" | "110" | "triangle-se-open" | "210" | "210" | "triangle-se-dot" | "310" | "310" | "triangle-se-open-dot" | "11" | "11" | "triangle-sw" | "111" | "111" | "triangle-sw-open" | "211" | "211" | "triangle-sw-dot" | "311" | "311" | "triangle-sw-open-dot" | "12" | "12" | "triangle-nw" | "112" | "112" | "triangle-nw-open" | "212" | "212" | "triangle-nw-dot" | "312" | "312" | "triangle-nw-open-dot" | "13" | "13" | "pentagon" | "113" | "113" | "pentagon-open" | "213" | "213" | "pentagon-dot" | "313" | "313" | "pentagon-open-dot" | "14" | "14" | "hexagon" | "114" | "114" | "hexagon-open" | "214" | "214" | "hexagon-dot" | "314" | "314" | "hexagon-open-dot" | "15" | "15" | "hexagon2" | "115" | "115" | "hexagon2-open" | "215" | "215" | "hexagon2-dot" | "315" | "315" | "hexagon2-open-dot" | "16" | "16" | "octagon" | "116" | "116" | "octagon-open" | "216" | "216" | "octagon-dot" | "316" | "316" | "octagon-open-dot" | "17" | "17" | "star" | "117" | "117" | "star-open" | "217" | "217" | "star-dot" | "317" | "317" | "star-open-dot" | "18" | "18" | "hexagram" | "118" | "118" | "hexagram-open" | "218" | "218" | "hexagram-dot" | "318" | "318" | "hexagram-open-dot" | "19" | "19" | "star-triangle-up" | "119" | "119" | "star-triangle-up-open" | "219" | "219" | "star-triangle-up-dot" | "319" | "319" | "star-triangle-up-open-dot" | "20" | "20" | "star-triangle-down" | "120" | "120" | "star-triangle-down-open" | "220" | "220" | "star-triangle-down-dot" | "320" | "320" | "star-triangle-down-open-dot" | "21" | "21" | "star-square" | "121" | "121" | "star-square-open" | "221" | "221" | "star-square-dot" | "321" | "321" | "star-square-open-dot" | "22" | "22" | "star-diamond" | "122" | "122" | "star-diamond-open" | "222" | "222" | "star-diamond-dot" | "322" | "322" | "star-diamond-open-dot" | "23" | "23" | "diamond-tall" | "123" | "123" | "diamond-tall-open" | "223" | "223" | "diamond-tall-dot" | "323" | "323" | "diamond-tall-open-dot" | "24" | "24" | "diamond-wide" | "124" | "124" | "diamond-wide-open" | "224" | "224" | "diamond-wide-dot" | "324" | "324" | "diamond-wide-open-dot" | "25" | "25" | "hourglass" | "125" | "125" | "hourglass-open" | "26" | "26" | "bowtie" | "126" | "126" | "bowtie-open" | "27" | "27" | "circle-cross" | "127" | "127" | "circle-cross-open" | "28" | "28" | "circle-x" | "128" | "128" | "circle-x-open" | "29" | "29" | "square-cross" | "129" | "129" | "square-cross-open" | "30" | "30" | "square-x" | "130" | "130" | "square-x-open" | "31" | "31" | "diamond-cross" | "131" | "131" | "diamond-cross-open" | "32" | "32" | "diamond-x" | "132" | "132" | "diamond-x-open" | "33" | "33" | "cross-thin" | "133" | "133" | "cross-thin-open" | "34" | "34" | "x-thin" | "134" | "134" | "x-thin-open" | "35" | "35" | "asterisk" | "135" | "135" | "asterisk-open" | "36" | "36" | "hash" | "136" | "136" | "hash-open" | "236" | "236" | "hash-dot" | "336" | "336" | "hash-open-dot" | "37" | "37" | "y-up" | "137" | "137" | "y-up-open" | "38" | "38" | "y-down" | "138" | "138" | "y-down-open" | "39" | "39" | "y-left" | "139" | "139" | "y-left-open" | "40" | "40" | "y-right" | "140" | "140" | "y-right-open" | "41" | "41" | "line-ew" | "141" | "141" | "line-ew-open" | "42" | "42" | "line-ns" | "142" | "142" | "line-ns-open" | "43" | "43" | "line-ne" | "143" | "143" | "line-ne-open" | "44" | "44" | "line-nw" | "144" | "144" | "line-nw-open" | "45" | "45" | "arrow-up" | "145" | "145" | "arrow-up-open" | "46" | "46" | "arrow-down" | "146" | "146" | "arrow-down-open" | "47" | "47" | "arrow-left" | "147" | "147" | "arrow-left-open" | "48" | "48" | "arrow-right" | "148" | "148" | "arrow-right-open" | "49" | "49" | "arrow-bar-up" | "149" | "149" | "arrow-bar-up-open" | "50" | "50" | "arrow-bar-down" | "150" | "150" | "arrow-bar-down-open" | "51" | "51" | "arrow-bar-left" | "151" | "151" | "arrow-bar-left-open" | "52" | "52" | "arrow-bar-right" | "152" | "152" | "arrow-bar-right-open" | "53" | "53" | "arrow" | "153" | "153" | "arrow-open" | "54" | "54" | "arrow-wide" | "154" | "154" | "arrow-wide-open" )
Default: "circle"Sets the marker symbol type. Adding 100 is equivalent to appending "-open" to a symbol name. Adding 200 is equivalent to appending "-dot" to a symbol name. Adding 300 is equivalent to appending "-open-dot" or "dot-open" to a symbol name.
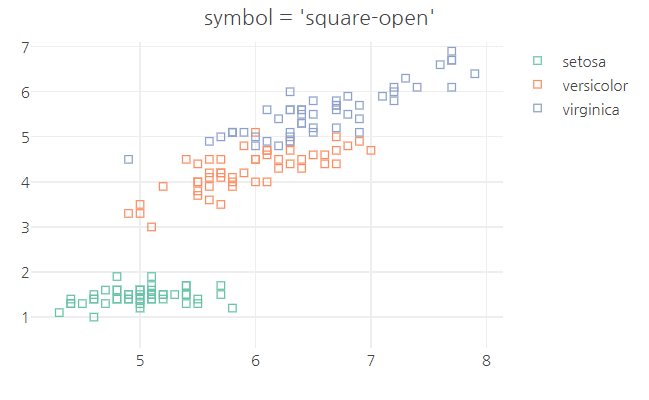
1) 전체 심볼 변경
- symbol을 'square-open'으로 변경할 것이다.
- color와 마찬가지로 I()함수를 사용하여 매핑해야 한다.
plot_ly(data=iris, x = ~Sepal.Length, y = ~Petal.Length,
        type='scatter',
        mode="markers",
        color = ~Species,
        symbol = I('square-open')) %>%

  layout(title = "symbol = 'square-open'",
         font=list(family ='nanumgothic'),
         xaxis = list(title=""),
         yaxis = list(title=""),
         margin = list(l=10, r=20, b=10, t=30, pad=0))
2) symbol 속성에 범주형 변수 매핑하기
- symbol에 범주형 변수를 매핑하면 그룹별로 symbol 모양을 달리 할 수 있다.
- iris의 Species 별로 symbol 달리 하기.
plot_ly(data=iris, x = ~Sepal.Length, y = ~Petal.Length,
        type='scatter',
        mode="markers",
        color = ~Species,
        symbol = ~ Species) %>%

  layout(title = "symbol = ~ Species",
         font=list(family ='nanumgothic'),
         xaxis = list(title=""),
         yaxis = list(title=""),
         margin = list(l=10, r=20, b=10, t=30, pad=0))

- symbols = c("심볼1", "심볼1",...)를 추가하여 직접 심볼을 변경할 수 있다.
plot_ly(data=iris, x = ~Sepal.Length, y = ~Petal.Length,
        type='scatter',
        mode="markers",
        color = ~Species,
        symbol = ~ Species,
        symbols =c("circle-cross-open",
                   "star-diamond",
                   "pentagon")) %>%

  layout(title = "Symbols",
         font=list(family ='nanumgothic'),
         xaxis = list(title=""),
         yaxis = list(title=""),
         margin = list(l=10, r=20, b=10, t=30, pad=0))

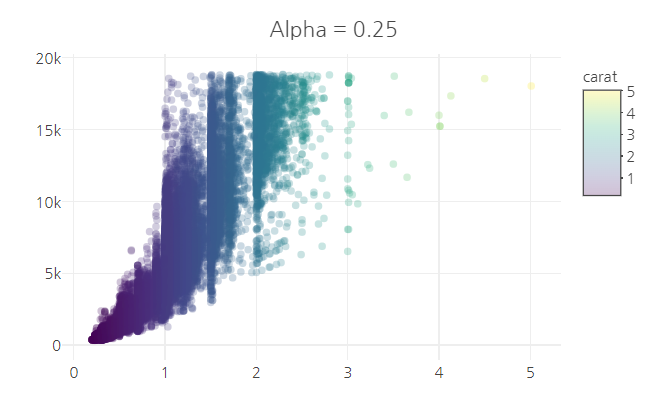
04. 점의 투명도 조절
- 데이터의 사이즈가 큰 경우 오버플로팅(Over-Ploting)이 일어날 수 있으므로 점의 투명도를 적절히 조절하는 것이 중요하다.
- 이를 해결하기 위해서 alpha 속성과 opacity 속성을 사용한다.
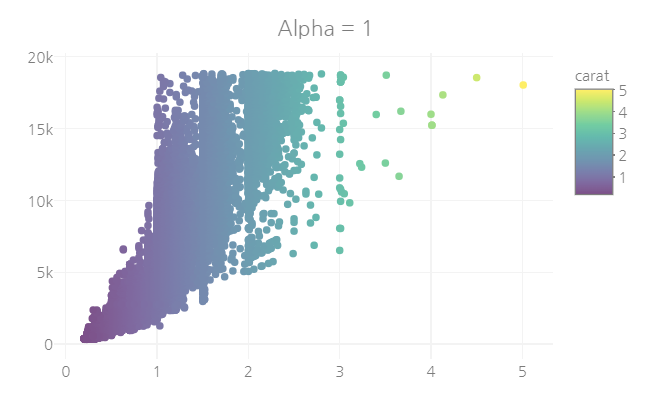
1) alpha
· ggplot2 패키지의 diamonds 데이터 셋 사용
plot_ly(data=diamonds, x = ~carat, y = ~price,
        type='scatter',
        mode="markers",
        color = ~carat,
        alpha =n) %>% # n은 0~1

  layout(title = "Alpha = 1",
         font=list(family ='nanumgothic'),
         xaxis = list(title="", zeroline =F),
         yaxis = list(title="", zeroline =F),
         margin = list(l=10, r=20, b=10, t=30, pad=0))
· alpha = 1
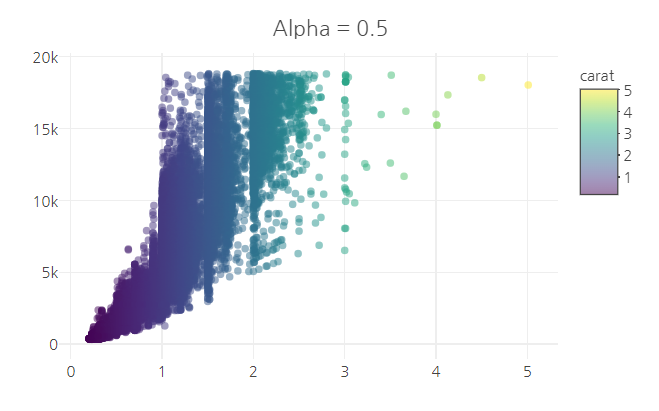
· alpha = 0.5
· alpha = 0.25

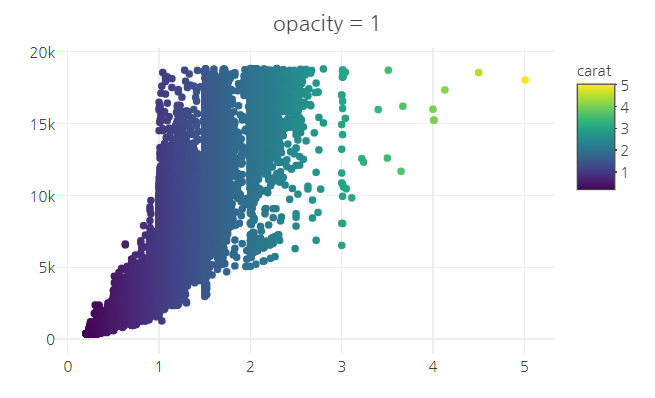
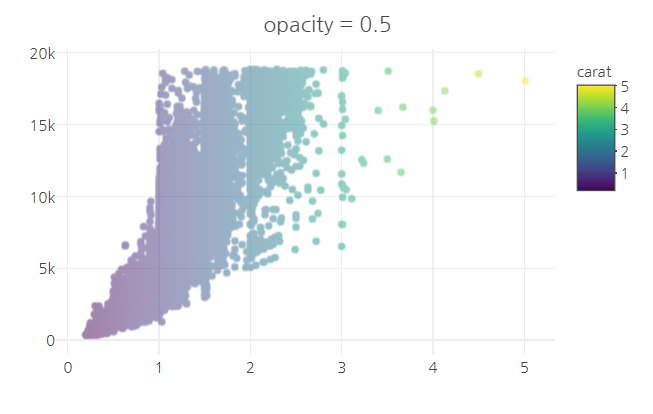
2) opacity
plot_ly(data=diamonds, x = ~carat, y = ~price,
        type='scatter',
        mode="markers",
        color = ~carat,
        opacity = n ) %>% # n은 0~1 사이의 숫자

  layout(title = "opacity = 1",
         font=list(family ='nanumgothic'),
         xaxis = list(title="", zeroline =F),
         yaxis = list(title="", zeroline =F),
         margin = list(l=10, r=20, b=10, t=30, pad=0))
· opacity = 1
· opacity = 0.5
· opacity = 0.5
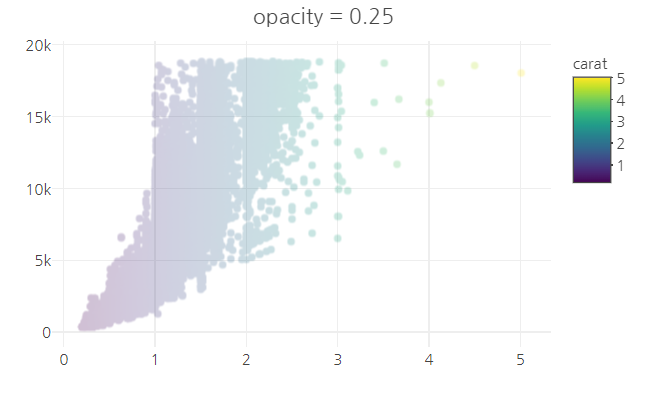
opacity의 경우 alpha와는 다르게 겹쳐지는 점들의 투명도를 계속 유지한다.
때문에 서로 겹쳐진 점들이 얼마나 분포하는지 파악하기 어렵다.
참고 문헌(reference)
참고 사이트
https://plotly.com/r/line-and-scatter/Scatter
Over 11 examples of Scatter and Line Plots including changing color, size, log axes, and more in R.
plotly.com
https://2stndard.tistory.com/86
plotly 점의 투명도 조절(alpha, opacity) in R
사용데이터 : https://2stndard.tistory.com/68 점의 투명도(alpha) 조절 산점도는 x, y 두개의 변수에 따른 데이터의 위치를 점으로 표현한 시각화 방법이다. 산점도를 통해 데이터의 전반적 분포와 X축의
2stndard.tistory.com
'R > plotly' 카테고리의 다른 글
| R | plotly | Line Plot - 선 그래프 (1) | 2023.02.02 |
|---|---|
| R | plotly | Bubble Chart - 버블 차트 (0) | 2023.02.01 |
| R | plotly | Violin Plot - 바이올린 플롯 (0) | 2023.01.31 |
| R | plotly | box plot (0) | 2023.01.31 |
| R | plotly | Bar Chart - 막대 그래프 (0) | 2023.01.30 |