ggplot2 패키지에서
산점도나 막대그래프의 레이블을 표시하는 방법 중 가장 간단한 것은
geom_text() 함수에서 aes 객체로 label을 설정하는 것이다.
geom_label()도 사용할 수 있지만 밑에서 보면 알겠지만 레이블이 사각형으로 둘러 쌓여 있어
레이블이 오버랩이 되는 경우가 있어 geom_text()를 더 많이 사용한다.
geom_text(
  mapping = NULL,
  data = NULL,
  stat = "identity",
  position = "identity",
  ...,
  parse = FALSE,
  nudge_x = 0,
  nudge_y = 0,
  check_overlap = FALSE,
  na.rm = FALSE,
  show.legend = NA,
  inherit.aes = TRUE
)
· 주요 Argrument
| Argument | 사용 방법 | 설명 |
| angle | angle = 45 | 텍스트의 각도를 조절 |
| color | text의 색상 지정 1) color = "컬러코드" 2) aes(size = 숫자형 변수 or 범주형 변수) |
2) color 속성에 범주형 변수를 매밍할 경우 변수의 범주별로 색상을 달리 지정할 수 있음 |
| family | family = "serif" | 텍스트의 폰트(글꼴) 지정 |
| fontface | fontface = "bold" | 텍스트의 글씨 볼드 처리/ 이탤릭 처리 |
| hjust, vjust | hjust = 0 | vjust(수직) or hjust(수평)을 사용해 텍스트 정렬을 가능 1) 0(오른쪽/아래) ~ 1(위/왼쪽) 사이의 숫자 2) 문자("left", "middle", "right", "bottom", "center", "top") 3) Inward는 항상 텍스트를 중앙으로 정렬하고 Outward는 중앙에서 멀리 정렬 |
| nudge_x, nudge_y | nudge_x = 숫자 | 수평, 또는 수직 방향으로 텍스트를 살짝 조정할 때, nudge_x, nudge_y에 수치를 입력하여 지정 |
| size | text의 사이즈 조절 1) size = 숫자 2) aes(size = 숫자형 변수) |
2) size 속성에 숫자형 변수를 매핑할 경우 숫자형 변수의 상대적인 크기에 따라 텍스트의 사이즈를 달리 할 수 있음. |
| check_overlap | check_overlap = TRUE | - TRUE: 같은 레이어에 중첩된 텍스트가 plot에 나타나지 않음. - FALSE: 중첩 무시(default) |
00. 사용 데이터 및 라이브러리 로드
· R의 내장 데이터 셋인 'mtcars' 사용
library(dplyr)
library(ggplot2)

library(showtext) ## 한글폰트 사용
library(ggthemes) ## 테마 설정
# install.packages("hrbrthemes")
library(hrbrthemes) ## 테마설정

### 한글 폰트 설정
font_add_google("Nanum Gothic", "nanumgothic")
showtext_auto()

01. 기본 geom_text()
· geom_text( aes ( x = , y = , label)) 을 지정해주면 기본적인 text plot을 그릴 수 있음.
ggplot(mtcars)+
  geom_text(aes(x = wt, y = mpg, label= rownames(mtcars)))

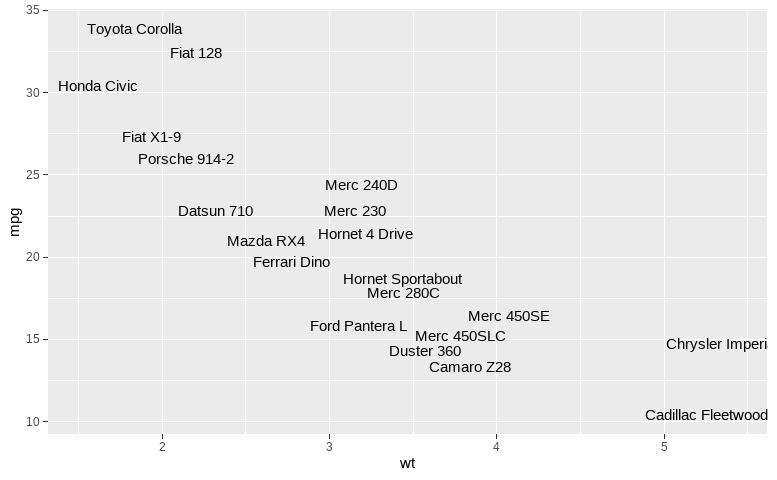
1) check_overlap = TRUE
· check_overlap = FALSE(default) 을 TRUE로 바꿔주면 Overlap된 text를 없앨 수 있음.
ggplot(mtcars)+
  geom_text(aes(x = wt, y = mpg, label= rownames(mtcars)),
            check_overlap = T)
2) size
· size 속성을 사용해서 text의 사이즈를 조절할 수 있음.
ggplot(mtcars)+
  geom_text(aes(x = wt, y = mpg, label= rownames(mtcars)),
            size = 6)

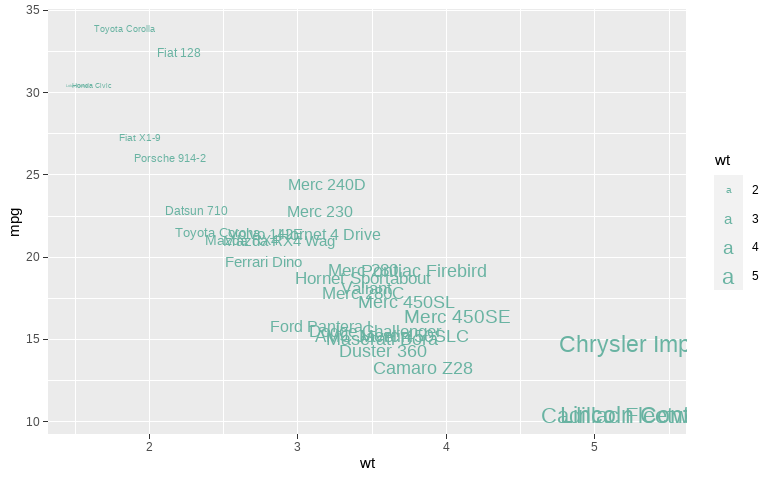
· size를 aes안에 매핑함으로써 wt 크기별로 사이즈를 설정할 수 있음
ggplot(mtcars)+
  geom_text(aes(x = wt, y = mpg, label= rownames(mtcars),
                size = wt)) # wt 크기별로 사이즈를 설정할 수 있음

3) color
· color = "컬러코드" : 모든 text를 동일한 컬러코드로 지정 가능.
ggplot(mtcars)+
  geom_text(aes(x = wt, y = mpg, label= rownames(mtcars),size = wt),
            color = "#69b3a2")
· aes(color = 범주형 변수)
: color 속성에 범주형 변수 'cyl' 를 매핑함으로써 cyl 별로 색을 달리 지정할 수 있음.
ggplot(mtcars)+
  geom_text(aes(x = wt, y = mpg, label= rownames(mtcars),
                color = factor(cyl)))

4) 텍스트 위치 조정
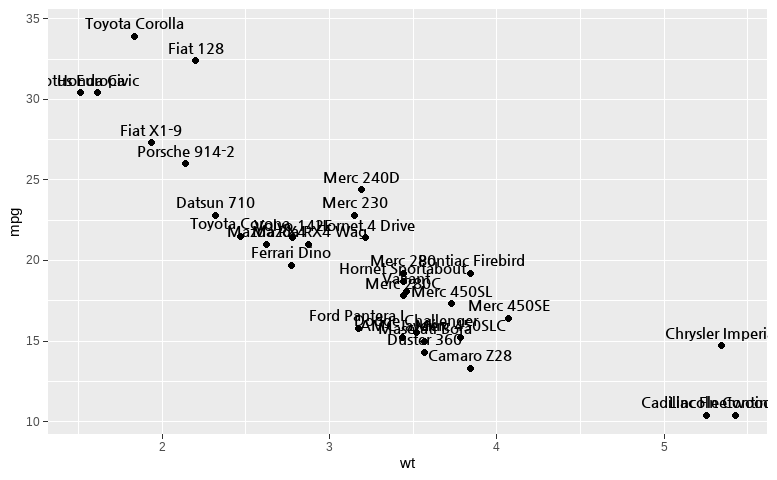
· 텍스트를 위치를 조정하지 않은 경우
ggplot(mtcars)+
  geom_point(aes(x = wt, y = mpg))+
  geom_text(aes(x = wt, y = mpg, label= rownames(mtcars)))

geom_point와 geom_text를 같이 사용하는 경우 text와 point가 겹치는 문제가 생기기 때문에 text가 잘 보이게 위치를 잘 조정해줘야 한다.
· hjust = 0, nudge_x = 0.05
ggplot(mtcars)+
  geom_point(aes(x = wt, y = mpg))+
  geom_text(aes(x = wt, y = mpg, label= rownames(mtcars)),
            hjust = 0, nudge_x = 0.05)

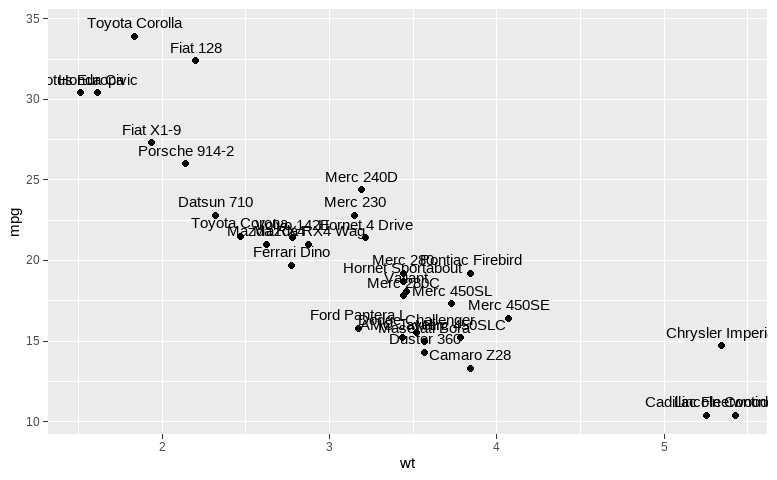
· vjust = 0, nudge_y = 0.5
ggplot(mtcars)+
  geom_point(aes(x = wt, y = mpg))+
  geom_text(aes(x = wt, y = mpg, label= rownames(mtcars)),
            vjust = 0, nudge_y = 0.5)
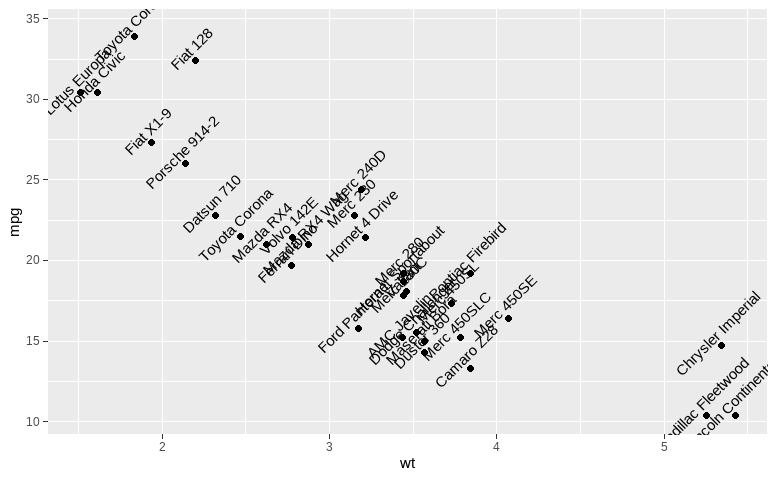
· 텍스트를 각도 조절 : angle 속성을 사용
ggplot(mtcars)+
  geom_point(aes(x = wt, y = mpg))+
  geom_text(aes(x = wt, y = mpg, label= rownames(mtcars)),
            vjust = 0, nudge_y = 0.5,
            angle = 45)
5) 텍스트 폰트 변경
· 폰트 변경 : family = "nanumgothic"
ggplot(mtcars)+
  geom_point(aes(x = wt, y = mpg))+
  geom_text(aes(x = wt, y = mpg, label= rownames(mtcars)),
            vjust = 0, nudge_y = 0.5,
            family = "nanumgothic")


· 텍스트 볼드/이탤릭 처리
: fontface = "bold" / fontface = "italic"
ggplot(mtcars)+
  geom_point(aes(x = wt, y = mpg))+
  geom_text(aes(x = wt, y = mpg, label= rownames(mtcars)),
            vjust = 0, nudge_y = 0.5,
            family = "nanumgothic",
            fontface = "bold") # 볼드처리

ggplot(mtcars)+
  geom_point(aes(x = wt, y = mpg))+
  geom_text(aes(x = wt, y = mpg, label= rownames(mtcars)),
            vjust = 0, nudge_y = 0.5,
            fontface = "italic")

02. 막대그래프에 geom_text() 적용
· 이전 geom_bar() 막대그래프 포스팅에서 그린 여러 종류의 막대그래프에 geom_text()를 추가할 것이다.
1) 기본 막대그래프 + geom_text()
· 텍스트를 ..count..변수로 이용하기 위해서는 geom_text()의 stat 값을 "count"로 변경해야 함
ggplot(diamonds, aes( x = cut, y =..count.., fill = cut)) +
  geom_bar() +
  geom_text(stat ="count",
            aes(label = ..count..),
            vjust =0, nudge_y = 1)+
  labs(title = "count")+

  theme_economist() +
  scale_fill_manual(values =economist_pal(fill = TRUE)(5))+
  theme(plot.title=element_text(family="nanumgothic", face="bold",
                                   hjust=0.5, vjust=-2, size=15),
        axis.text=element_text(family="nanumgothic", face="bold", size=9),
        legend.text = element_text(family="nanumgothic", size=9),
        legend.position='right')

2) Dodge 막대그래프 + geom_text()
· dodge 막대그래프에 텍스트를 ..count.. 변수로 사용하려면 geom_text()에 stat = "count" 와
position = position_dodge(width=) 를 꼭 넣어줘야 한다.
diamonds %>% dplyr::filter(color == 'D' | color =='E') %>% # color가 'D' or 'E'인 행 필터링

ggplot(aes(x = color, y =..count.., fill = cut)) +
  geom_bar(position = "dodge") +
  geom_text(stat ="count",
            position =  position_dodge(width = 0.9),
            aes(label = ..count..),
            vjust = -0.8)+
  labs(title = "count")+

  theme_economist() +
  scale_fill_manual(values =economist_pal(fill = TRUE)(5))+
  theme(plot.title=element_text(family="nanumgothic", face="bold",
                                   hjust=0.5, vjust=-2, size=15),
        axis.text=element_text(family="nanumgothic", face="bold", size=9),
        legend.text = element_text(family="nanumgothic", size=9),
        legend.position='right')

3) Stack 막대그래프 + geom_text()
· stack 막대그래프에 텍스트를 ..count.. 변수로 사용하려면 geom_text()에 stat = "count" 와
position = position_stack(vjust=) 를 꼭 넣어줘야 한다.
ggplot(diamonds, aes(x = color, y =..count.., fill = cut)) +
  geom_bar(position = "stack") +
  geom_text(aes(label =..count..),
            stat ="count",
            position =  position_stack(vjust = 0.5),
            color = "white", size = 4, fontface ="bold")+
  labs(title = "count")+

  theme_economist() +
  scale_fill_manual(values =economist_pal(fill = TRUE)(5))+
  theme(plot.title=element_text(family="nanumgothic", face="bold",
                                   hjust=0.5, vjust=-2, size=15),
        axis.text=element_text(family="nanumgothic", face="bold", size=9),
        legend.text = element_text(family="nanumgothic", size=9),
        legend.position='right')

4) fill (비율) 막대그래프 + geom_text()
· 비율 막대그래프에 상대적 비율을 text로 추가하기 위해서는 그 해당 비율을 미리 계산한 후 계산된 값을 label에 지정해줘야 한다.
diamonds %>%
  ggplot(aes(color, fill=cut)) +
  geom_bar(position = 'fill') +
  geom_text(data = . %>%
              group_by(color, cut) %>%
              tally() %>%
              mutate(p = n / sum(n)) %>%
              ungroup(),
            aes(y = p, label = p %>% round(2)),
            position = position_fill(vjust = 0.5),
            color = "white", size = 4, fontface ="bold")+
  labs(title = "fill")+

  theme_economist() +
  scale_fill_manual(values =economist_pal(fill = TRUE)(5))+
  theme(plot.title=element_text(family="nanumgothic", face="bold",
                                   hjust=0.5, vjust=-2, size=15),
        axis.text=element_text(family="nanumgothic", face="bold", size=9),
        legend.text = element_text(family="nanumgothic", size=9),
        legend.position='right')

참고 문헌(reference)
사용 데이터
참고 서적 / 위키북스|Must Learning with R (개정판)
https://wikidocs.net/book/4315
Must Learning with R (개정판)
MustLearning with R 개정판입니다. 기존 제작한 책에서 다시 만들려고 했으나, 책의 구성이 어느정도 바뀐 부분도 있기 때문에 다시 새롭게 구성을 하였습…
wikidocs.net
참고 사이트
https://ggplot2.tidyverse.org/reference/geom_text.html
Text — geom_label
Text geoms are useful for labeling plots. They can be used by themselves as scatterplots or in combination with other geoms, for example, for labeling points or for annotating the height of bars. geom_text() adds only text to the plot. geom_label() draws a
ggplot2.tidyverse.org
https://m.blog.naver.com/definitice/221162502291
29. R의 시각화(그래프) 기능(11) - ggplot2 사용법(기타 : 범례, 레이블, 텍스트 추가 등)
이번 포스트에서는 ggplot2의 템플릿에 굳이 포함시킨다면 theme 함수 부분으로 포함되어야 할 기타 설정 ...
blog.naver.com
Adding percentage labels to ggplot when using stat_count
For some reason, I can't seem to be able to add correct proportion labels to a ggplot by using stat_count. The code below returns labels that display 100% for all categories, even though I'm using ...
stackoverflow.com
'R > ggplot2' 카테고리의 다른 글
| R | ggmap | 지도 시각화(2) - line (0) | 2023.01.26 |
|---|---|
| R | ggmap | 지도 시각화(1) (0) | 2023.01.25 |
| R | ggplot2 | Line Plot (0) | 2023.01.18 |
| R | ggplot2 | Scatter Plot(산점도) (0) | 2023.01.17 |
| R | ggplot2 | Boxplot (0) | 2023.01.16 |
